


Weekly market update
Investment markets and key developments
After a relatively quiet start to the week, news on US auto tariffs has unnerved markets.
10 min read

After a relatively quiet start to the week, news on US auto tariffs and worries of a slowing US economy unnerved markets. Prior to this, the US sharemarket had rallied 5% from its mid-March bottom (after having declined by 10% from its high). Over the week, US shares are down by 1.5%. Australian shares managed to rise by 0.6% with financials and energy up, consumer discretionary higher (reflecting more cost of living relief in the Federal budget) while tech, real estate and health stocks fell over the week. Eurozone stocks have fallen, after strong performance in recent weeks and Japanese shares are also lower over the week while China is flat. The US dollar down over the week and ~5% below its early 2025 highs. US bond yields fell with the 10-year at 4.24%, gold prices remain at a record high of $3085/ounce, oil prices are contained at ~$70/barrel, Bitcoin is below its highs at around $84,000 and the $A is just under 0.63USD.
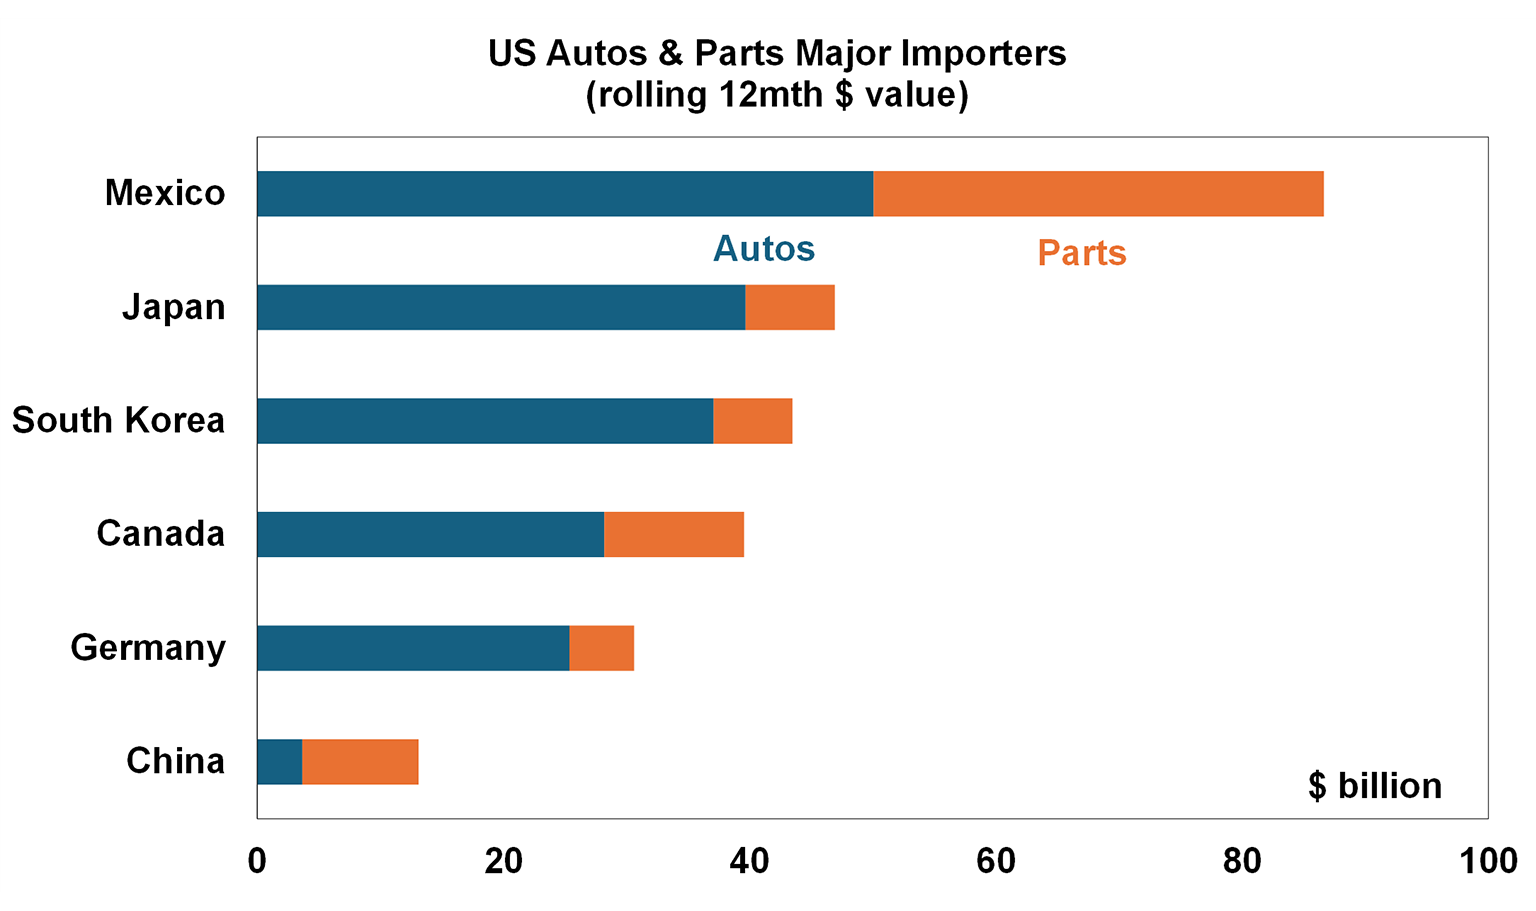
Trump announced tariffs on autos will start from 3 April, preceding the 2 April “Liberation Day” announcement of the broader set of new tariffs. Auto tariffs will increase to 25% (currently around 3%) on all cars not produced in the US, including car parts (from 3 May). Cars and parts make up a decent 11.3% of total US goods imports at $377bn, with 36% coming from Mexico (with the final assembly of numerous cars done in Mexico), 13.2% from Canada, 12.9% from Japan, 11.6% from South Korea and 8.6% from Germany.
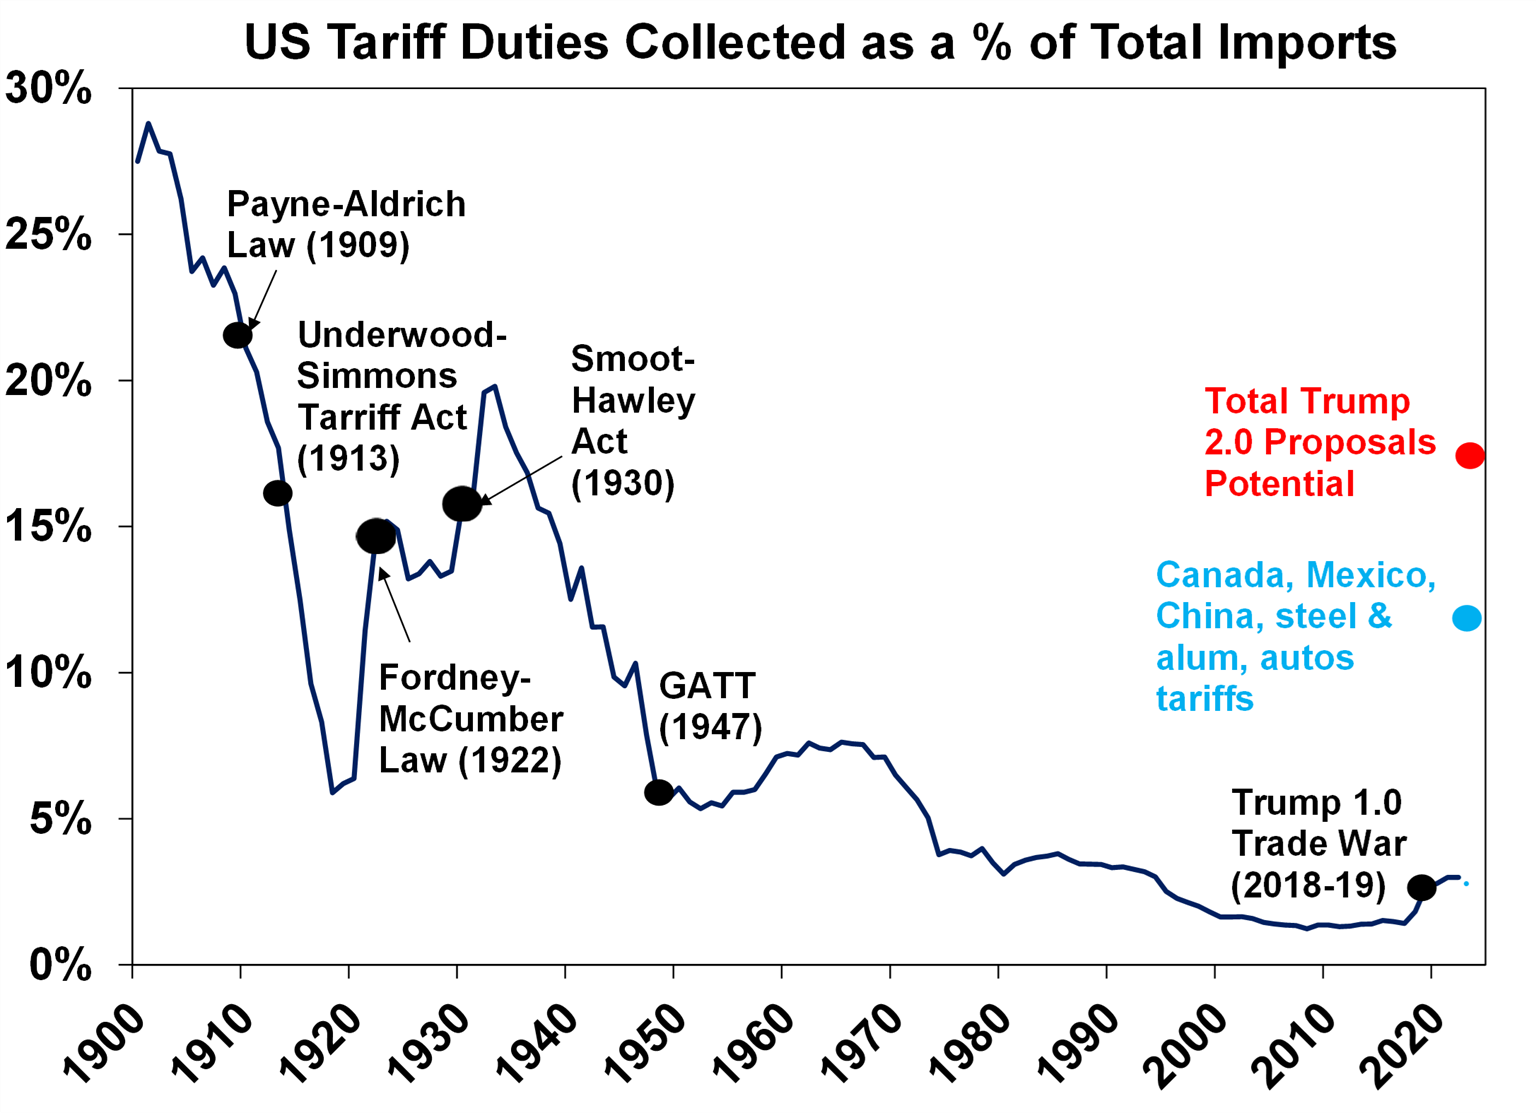
While tariffs will target foreign made goods, the issue is that the car manufacturing processes span multiple borders. Some US-based auto firms like Ford and General Motors may still be impacted despite being a local business because parts for cars will be derived offshore. Looks like Tesla may be the only beneficiary from these new tariffs (shocking!), although its share price also fell after the announcement. Alongside the already announced tariffs on China, Canada, Mexico and steel and aluminium, the average US tariff rate will rise to 12%, from its pre-Trump level of 3%, the highest level the US has had since the 1940’s (see the chart below). Trump’s election campaign indicated that the US tariff rate would rise to 17%, so we are getting close to that level, which is concerning from a growth and inflation point of view.
Financial markets are sensitive to news around tariffs, so it’s likely that shares will have more downside next week on 2 April. Reciprocal tariffs to “equalise” global tariffs on the US are expected, but sector specific tariffs could be postponed according to comments from Trump this week. While the details are up in the air, our view is that investors should expect a further rise in US tariffs in the near-term because Trump and his team (including Secretary of Commerce Lutnick and Secretary of the Treasury Bessent) are firm believers of using tariffs to level the global playing field on trade, bring an additional source of revenue into the US and revive US domestic production. This indicates that there is more downside to US shares in the near-term as investors will get worried that US tariffs will hurt US growth by increasing consumer prices, decreasing consumption, lifting business uncertainty, reducing business investment and hitting trade. It’s hard to say whether tariffs will actually tip the US economy into a downturn. Our base case is that it won’t because tariffs will end up being focussed on items the US can’t produce itself (so not to hurt consumers too much), Fed interest rate cuts are helping the cyclical parts of the market and some of Trump’s more pro-growth policies like tax cuts and deregulation should support the economy from later in 2025. So, while there may be further downside to shares in the short-term, we remain optimistic on sharemarket returns over the next year. Either way April 2 should remove some of the trade uncertainty for markets which could be a good thing, even if tariff rates do go up.
Major global economic events and implications
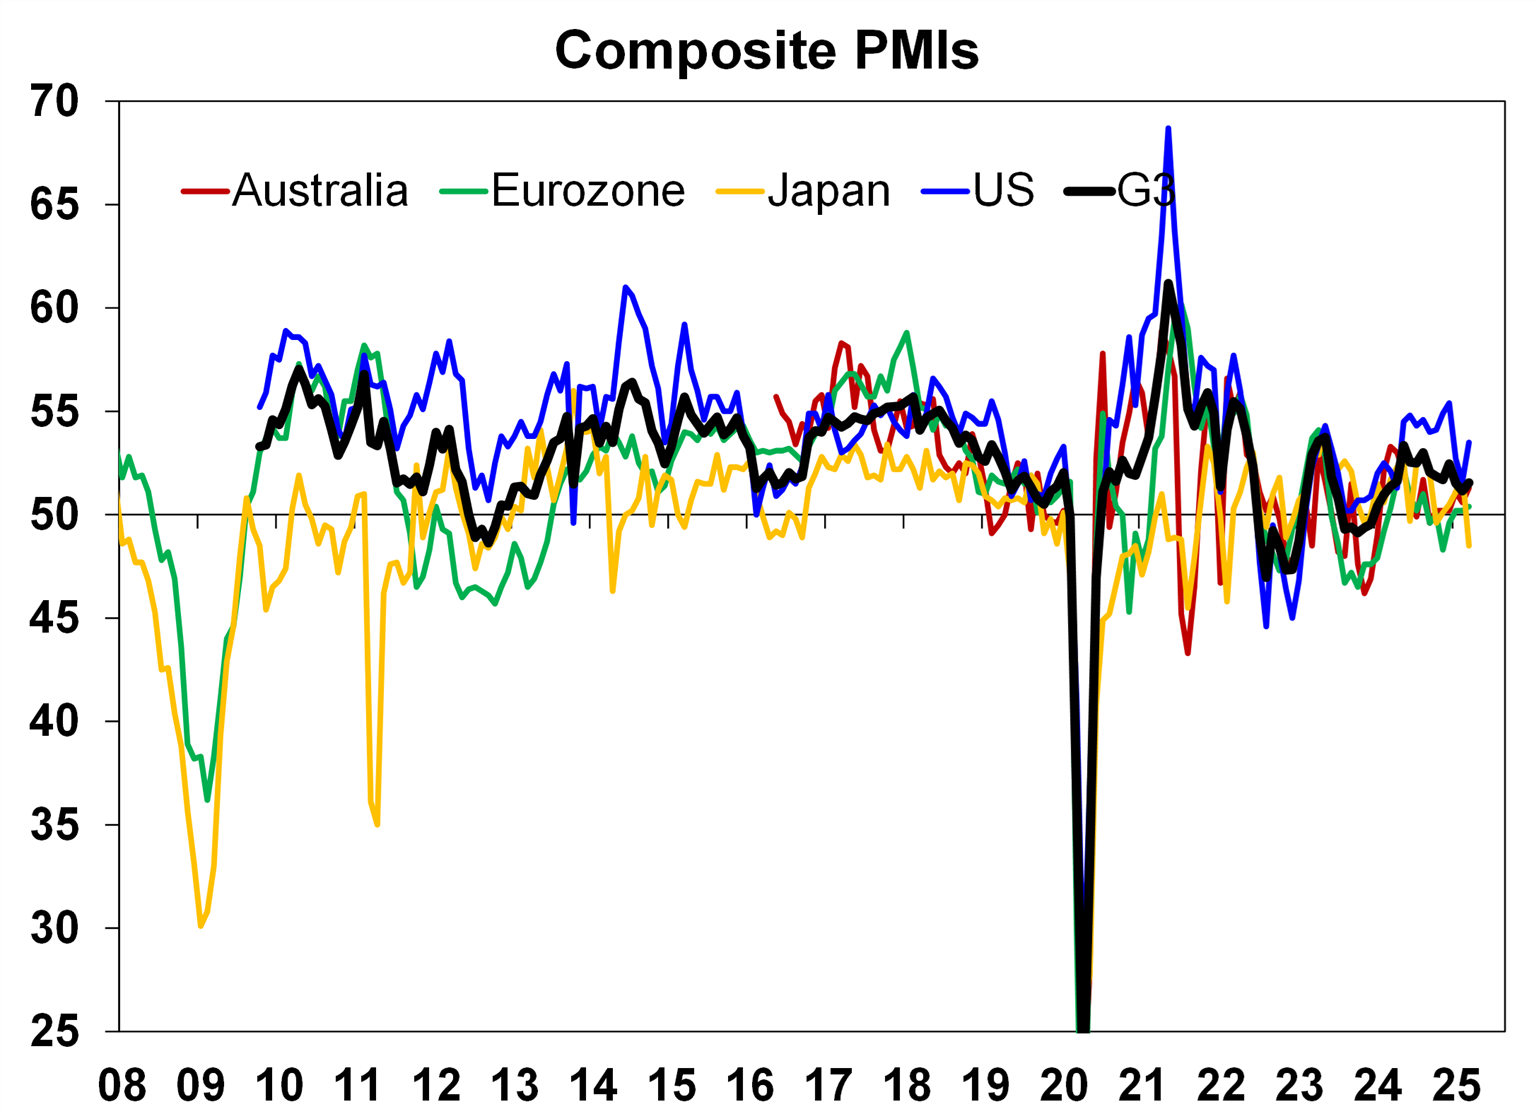
Global PMI updates were mixed for March. The US composite measure lifted to 53.5, from 51.6 last month, with services outperforming but manufacturing slowing back into “contraction” (i.e. a reading below 50). Eurozone manufacturing conditions improved (but are still below 50), but services disappointed expectations (although is still positive). The overall Eurozone PMI index is positive at 50.4 (from 50.2 last month).
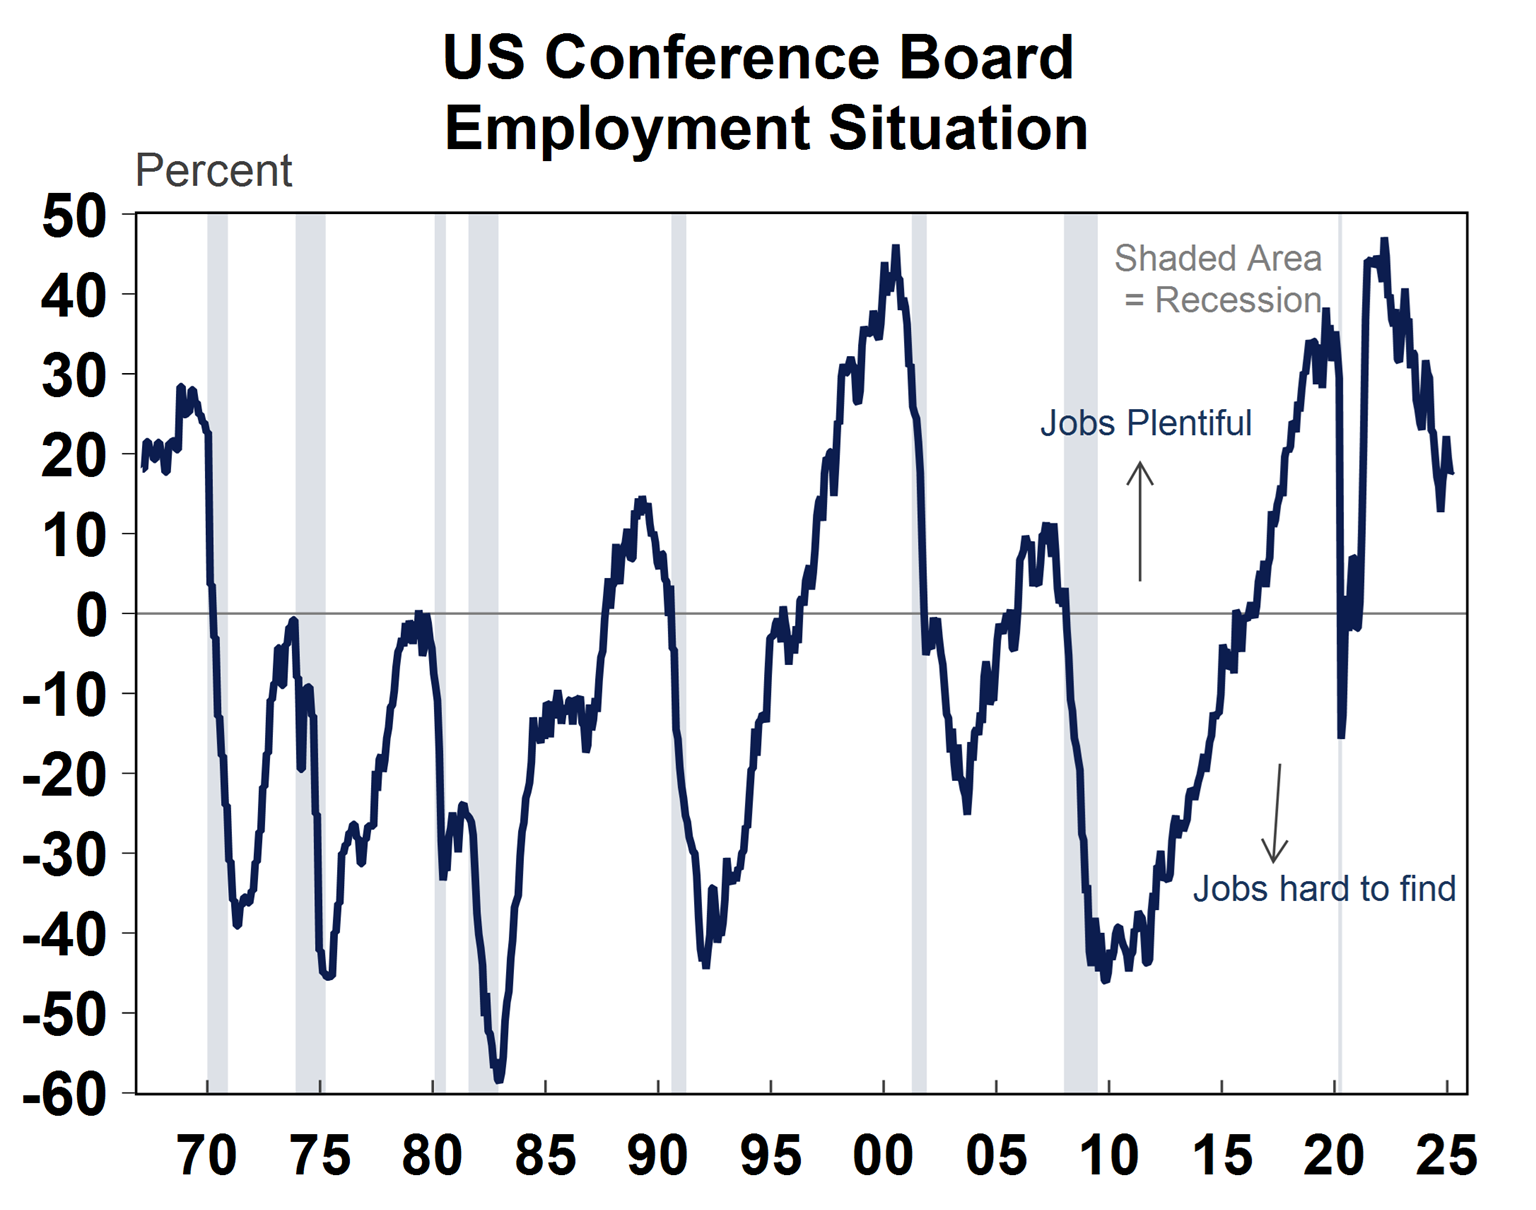
The Conference Board consumer confidence index tanked to 92.9 in March, from 100.1 last month, the lowest reading since July 2015 (outside of the pandemic), in line with other consumer and business confidence indicators that have softened in recent months from US policy uncertainty.
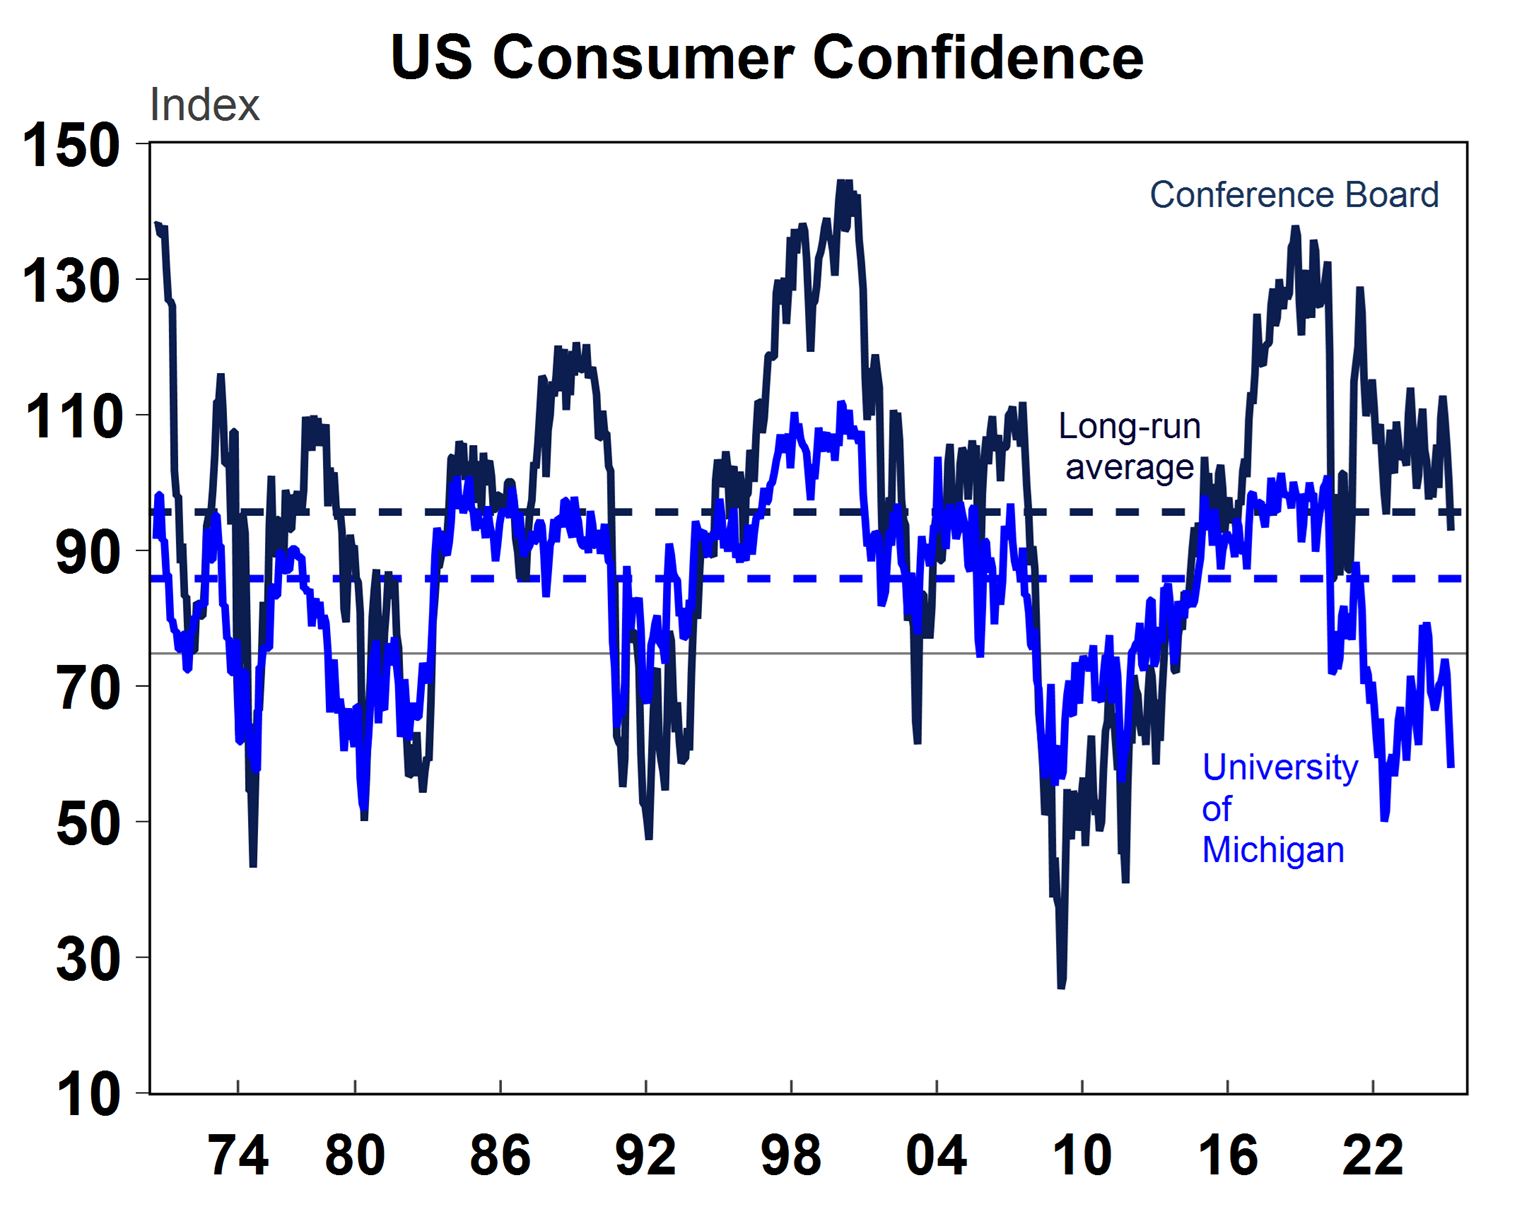
The employment-specific component of the Conference Board survey suggests that jobs are still plentiful (see the chart below).
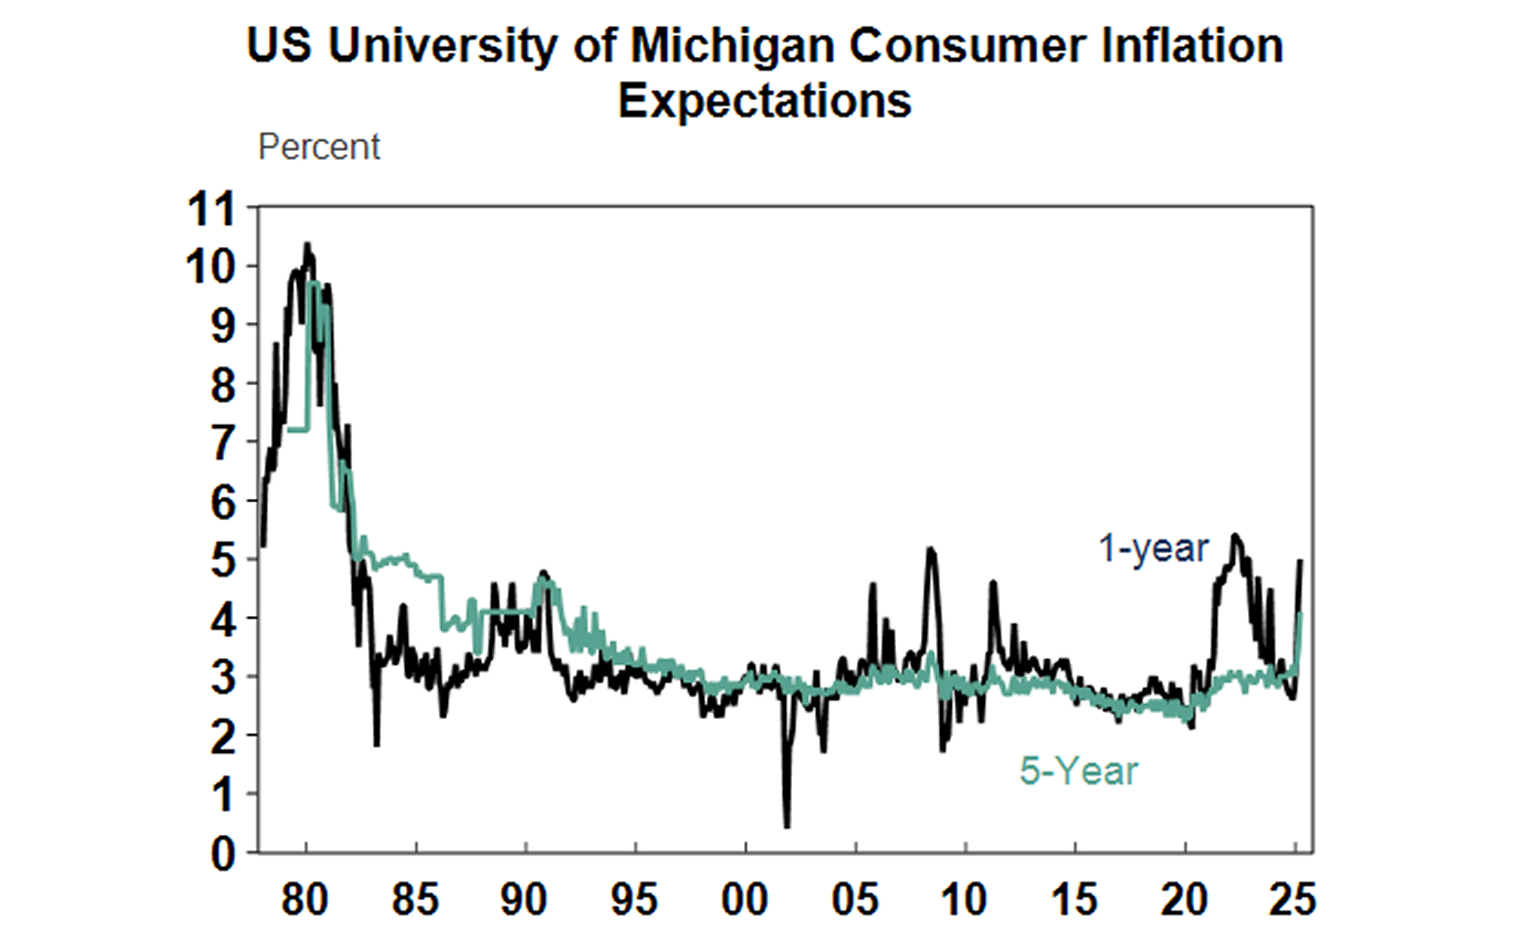
The University of Michigan consumer inflation expectations index increased again, with 1-year inflation expectations lifting to 5%, the highest since 2008 (outside the pandemic) and 5-10 year inflation expectations rose to 4.1%, the highest since the early 1990’s. Medium-term inflation expectations didn’t even reach this level during the pandemic when actual inflation reached its highest level since the 1980’s.
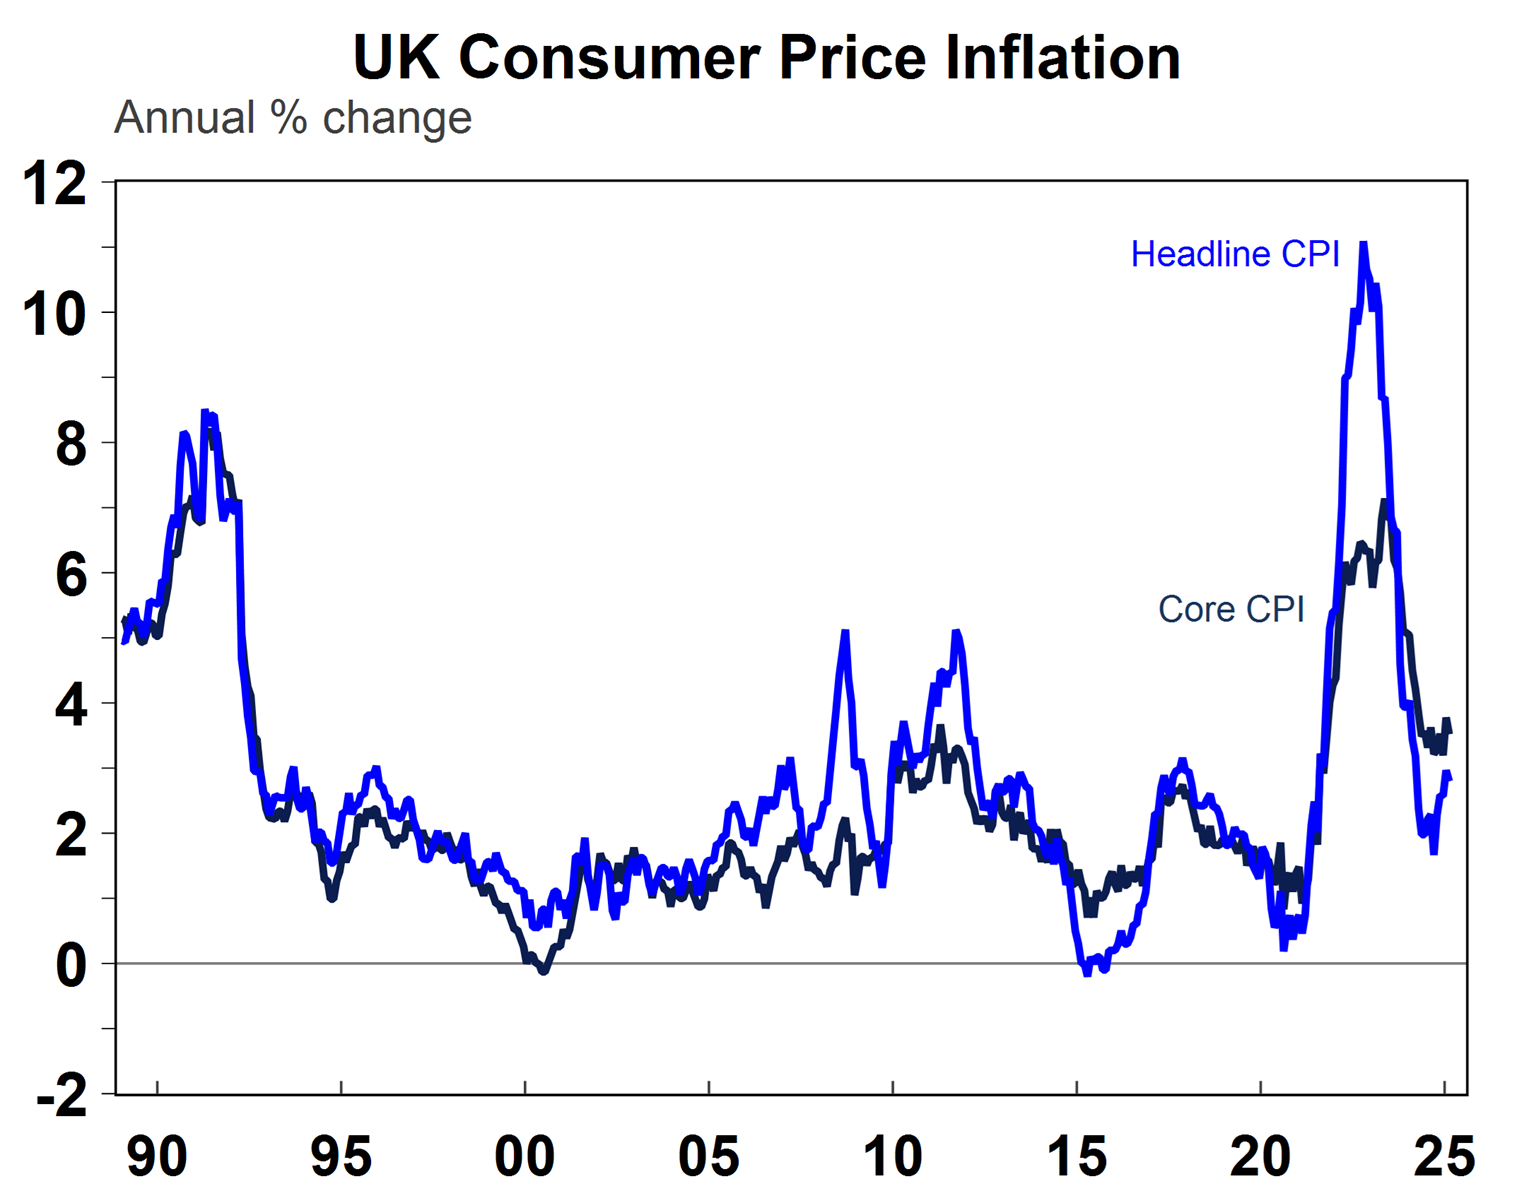
UK inflation data showed headline price growth at 2.8% over the year to February, but core still high at 3.5% (although lower than last month at 3.7%) and services inflation elevated at 5%. Another rate cut from the Bank of England is likely in May.
Australian economic events and implications
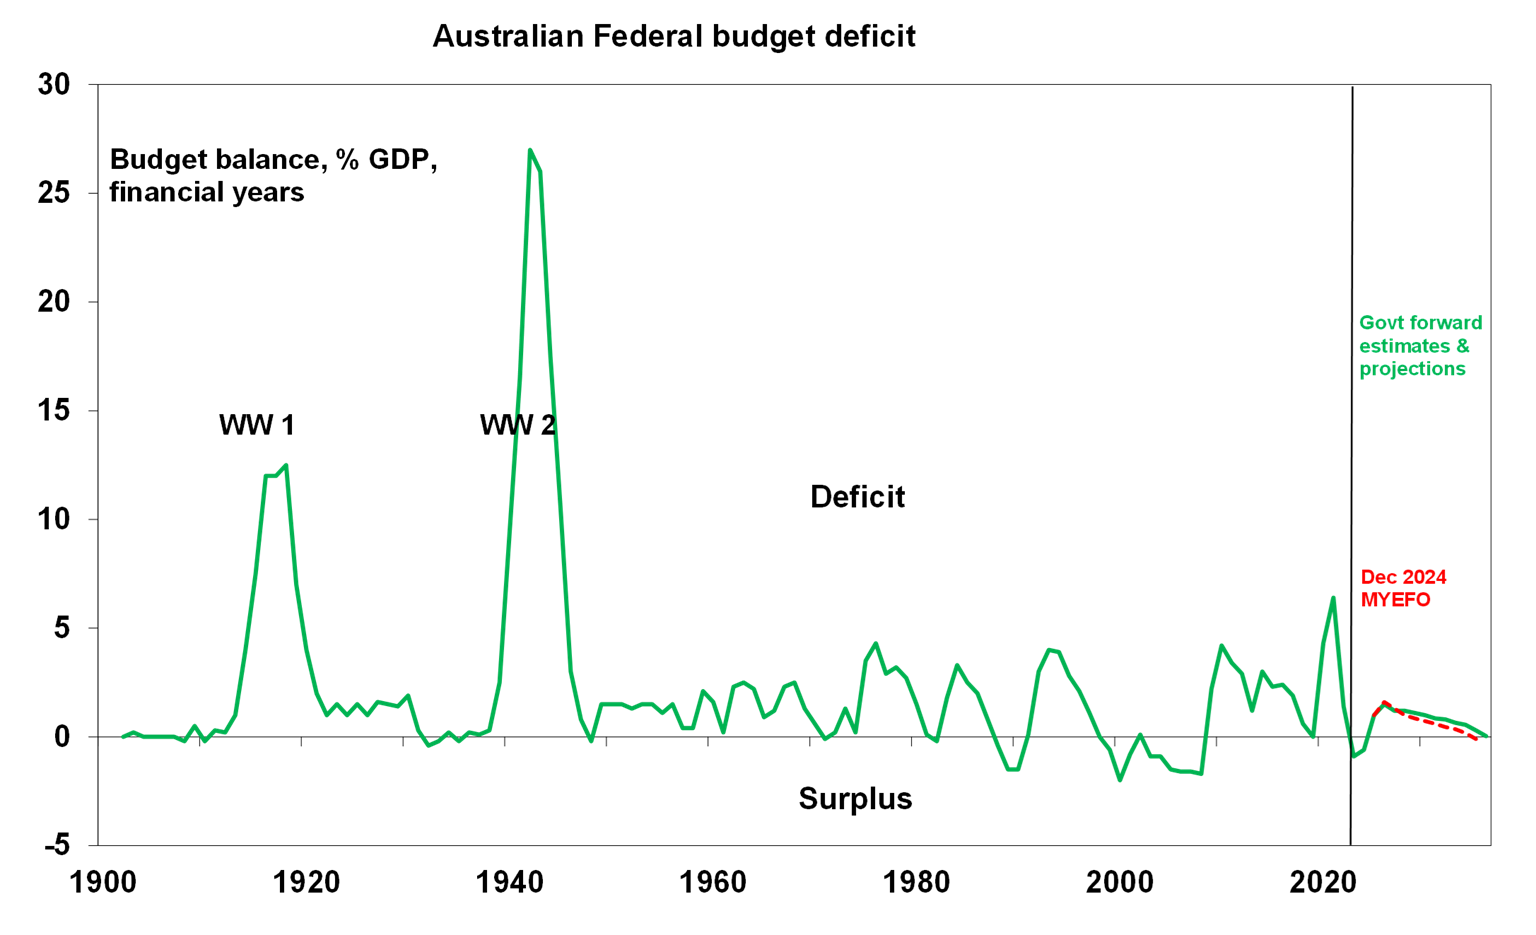
The 2025-26 Federal Budget was released this week. In our view, it was a pretty uninspiring document (see here for our detailed analysis). The headline budget numbers showed the budget slipping back into deficit this financial year, and over the next 10 years. The budget had been in surplus for the last two years thanks to a stronger-than-expected economy which boosted government revenue via taxation (individual and corporate), rather than good economic policy. Ongoing large budget deficits into the future (at around 1-1.5% of GDP) are a result of structural pressures from interest costs, the NDIS, defence, health and aged care which will mean that government spending will average 26.7% over the long term, compared to 24.8% prior to Covid. This locks in a large government sector, which will put upward pressure on inflation (and interest rates as a result).
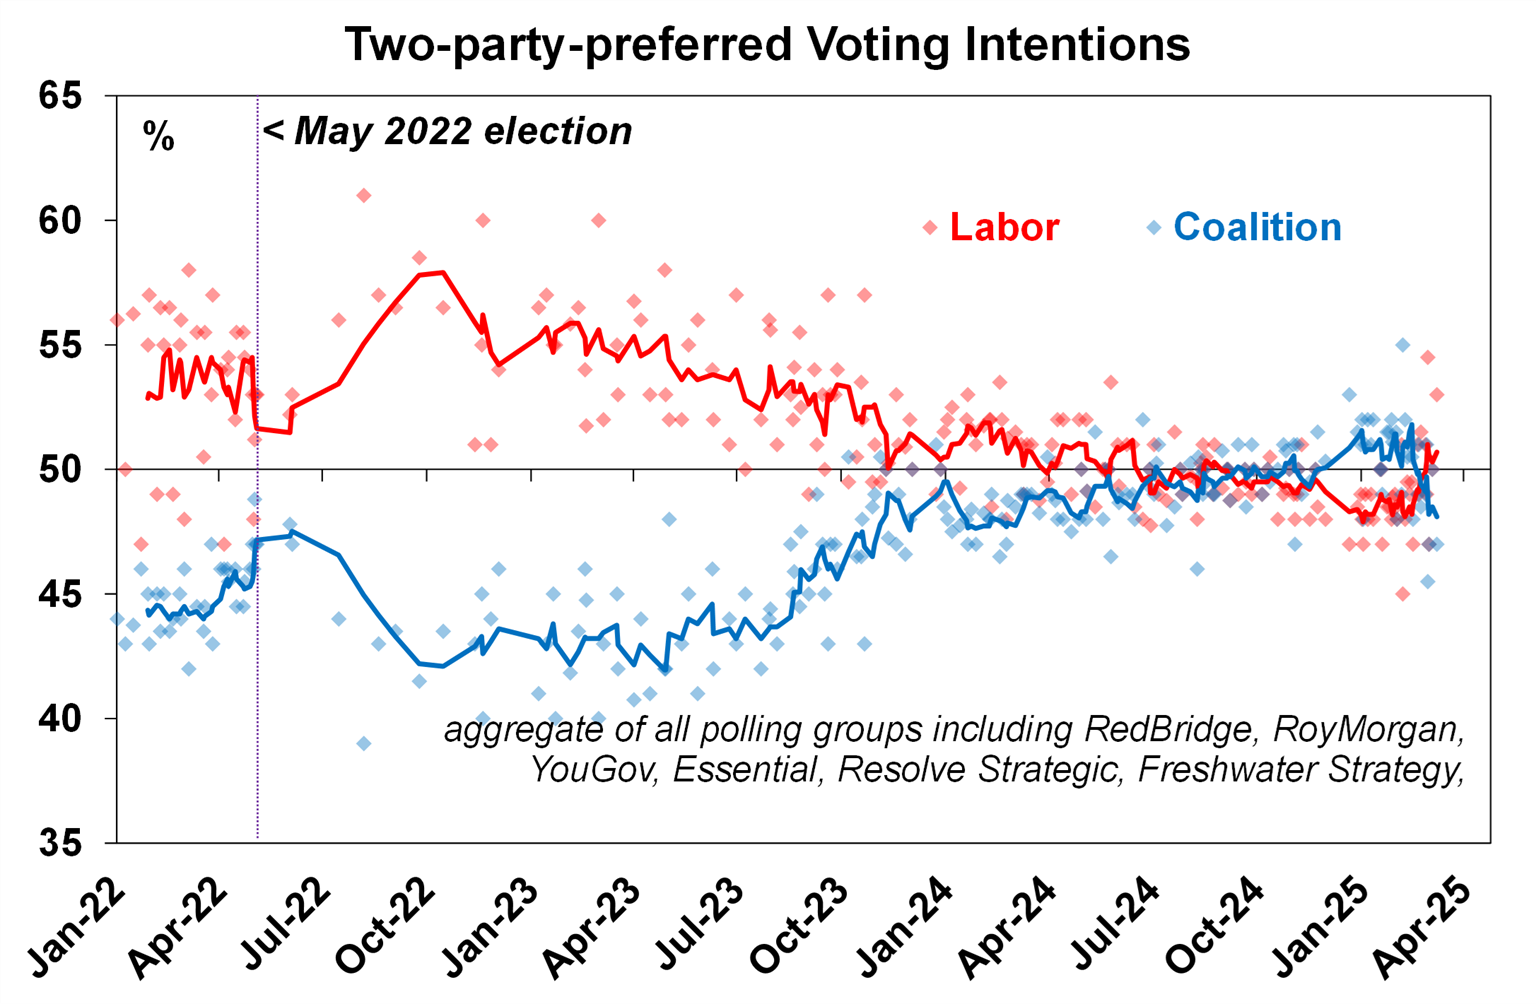
In any budget there are always more winners than losers, and this time there were even less losers than usual! It is an election budget, so giving money back to households was key via cost-of-living relief which was done through tax cuts (worth $5.15/week from July next year and $10.3 from July 2027), cheaper medicines (by capping PBS drug prices), and $150 electricity rebates for individuals and small business. Other policies included more spending on Medicare, infrastructure, increasing the income and price cap for the Help to Buy equity scheme for housing, a freeze on beer indexation and subsidies to support Australian industries as an offset to Trump tariffs. All of these measures have merit, but are not going to change the trajectory for the Australian economy in the short or medium term. Minor microeconomic reform like abolishing non compete clauses for those earning $175K are arguably good for productivity growth, but will impact at the margin. The fundamental problem in Australia is that the government is too reliant on income taxation and has a ballooning budget over the forecast horizon which requires serious structural reform. But this budget may be enough to win Labor the election, which PM Albanese has set for May 3. The polls are very close, but have swung back into Labor’s favour (see the chart below).
In Peter Dutton’s budget reply, the key polices announced from the opposition included a halving in the fuel excise for 12 months, a 25% cut to immigration, a 20% cut to Federal government employees (not on the front line), scrap production credits for Green Hydrogen, stop rewiring Australia fund, a housing plan to create 500,000 new homes, increase the instant asset write off for small business, lift apprenticeship and trainee places by 400K and deliver an East Coast gas reservation fund which on the Coalitions estimates would get 10-20% more gas into the domestic market. Dutton said that their aim was to “Make Australia a mining, agricultural, construction and manufacturing powerhouse once again” – sounds familiar to me!
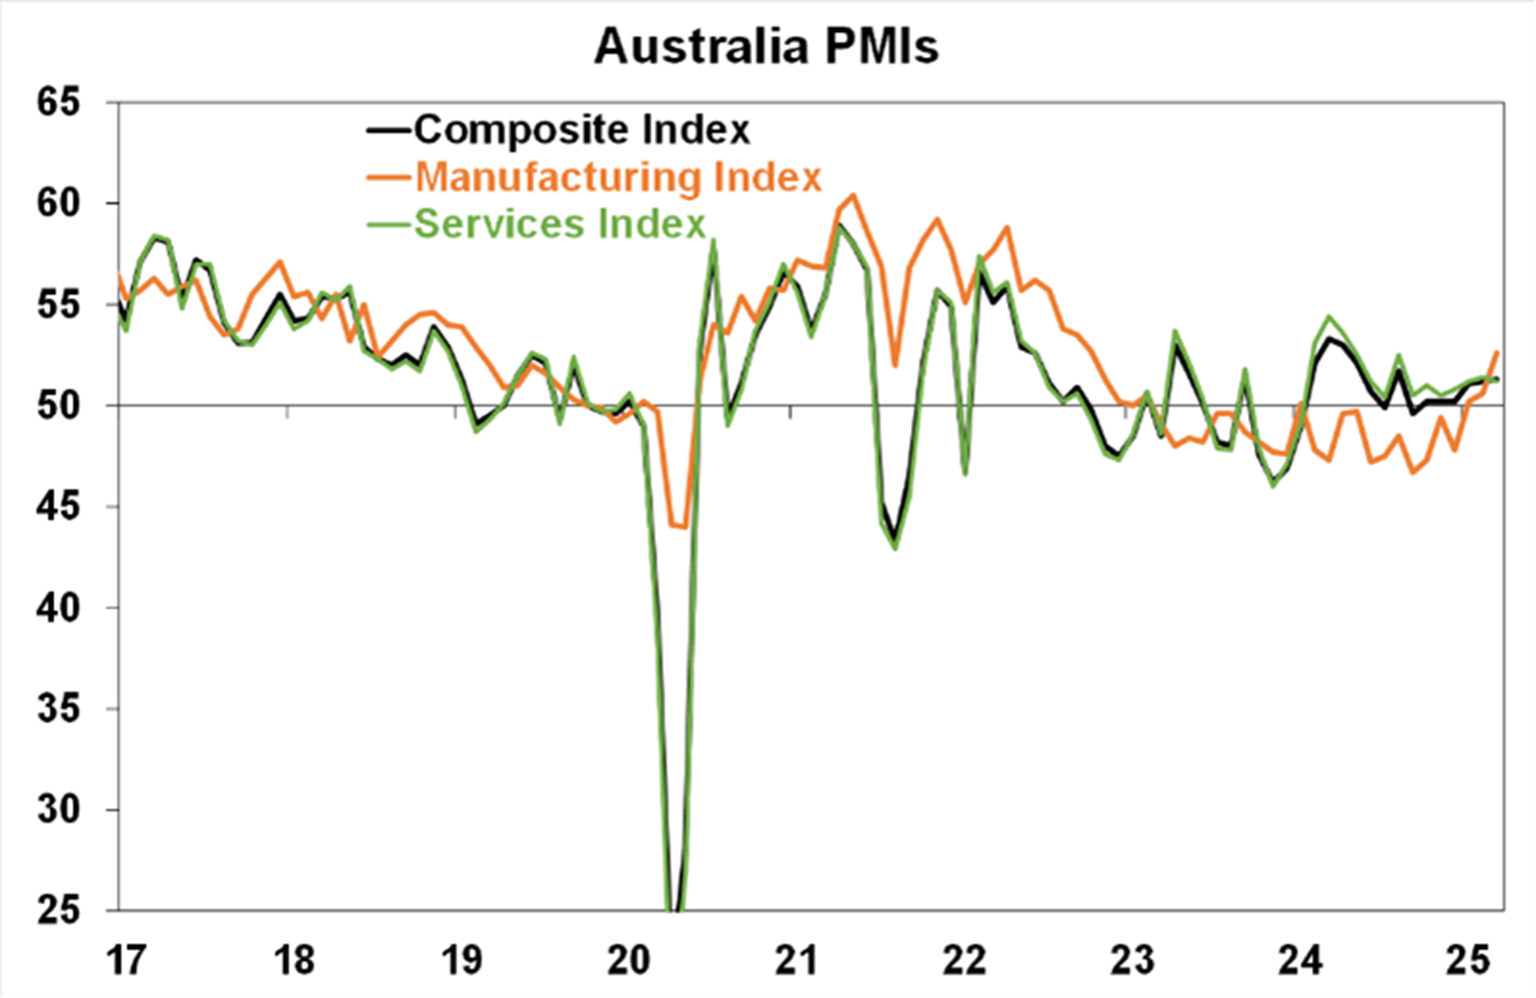
The March Purchasing Managers Index improved for services (to 51.2 from 50.8 last month) and manufacturing (to 52.6 from 50.4) remembering that a number above 50 indicates expansion and a figure below is contraction. The manufacturing index has been stuck below 50 since 2023. Within the components, work backlogs improved, output prices were down but input prices rose. And the employment sub-index also lifted, which is similar to the signal from employment leading indicators of an improvement in forward-looking labour market conditions.
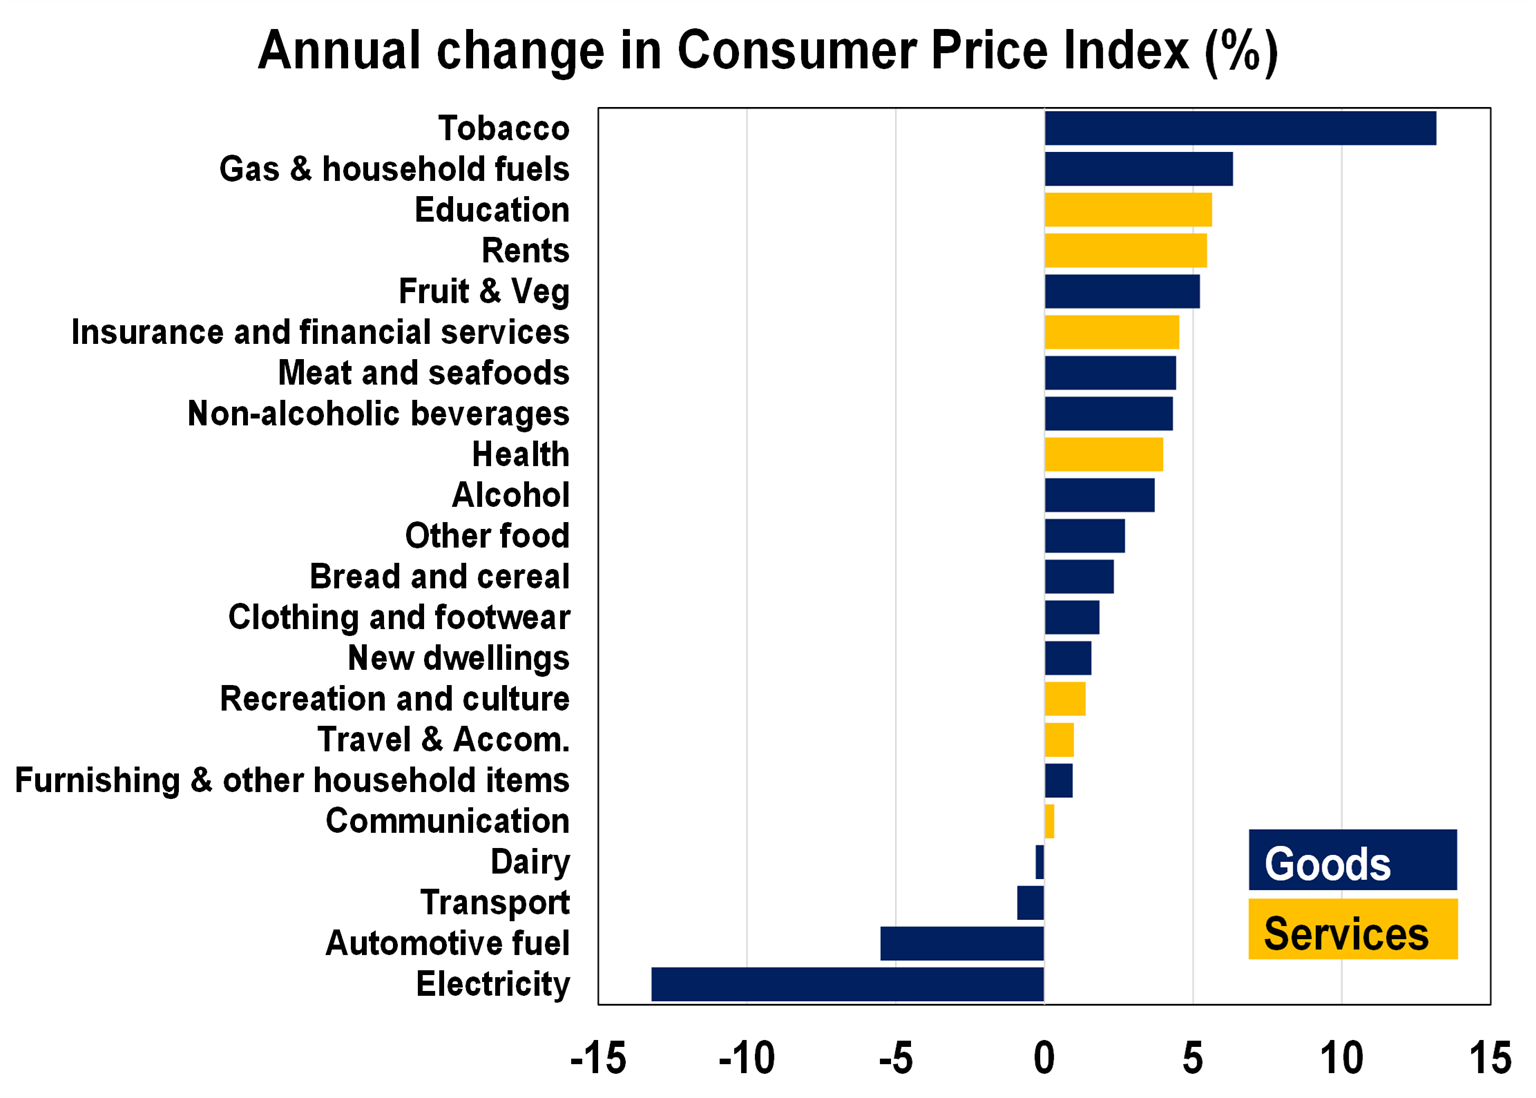
The February monthly consumer price indicator rose by 2.4% over the year (lower than consensus estimates of +2.5% and in line with our expectation). The monthly trimmed mean rose by 2.7% over the year, from 2.8% last month. Food inflation eased (although is still elevated at 3.1% year on year), alcohol and tobacco are very high from the tobacco excise, clothing and footwear inflation has eased to 1.8% over the year, housing related prices have also moderated (up by 1.8% year on year) from slower rents (+5.5% year on year), lower construction costs and a big decline in electricity prices from the government rebate, transport prices eased further in February from a fall in fuel, recreation inflation was up 1.4% over the year to February (well done from its post-pandemic highs), education inflation is elevated at 5.6% over the year and insurance and financial services prices have eased to +4.5% over the year. All up, it was a good set of figures that indicates a further moderation in consumer price inflation.
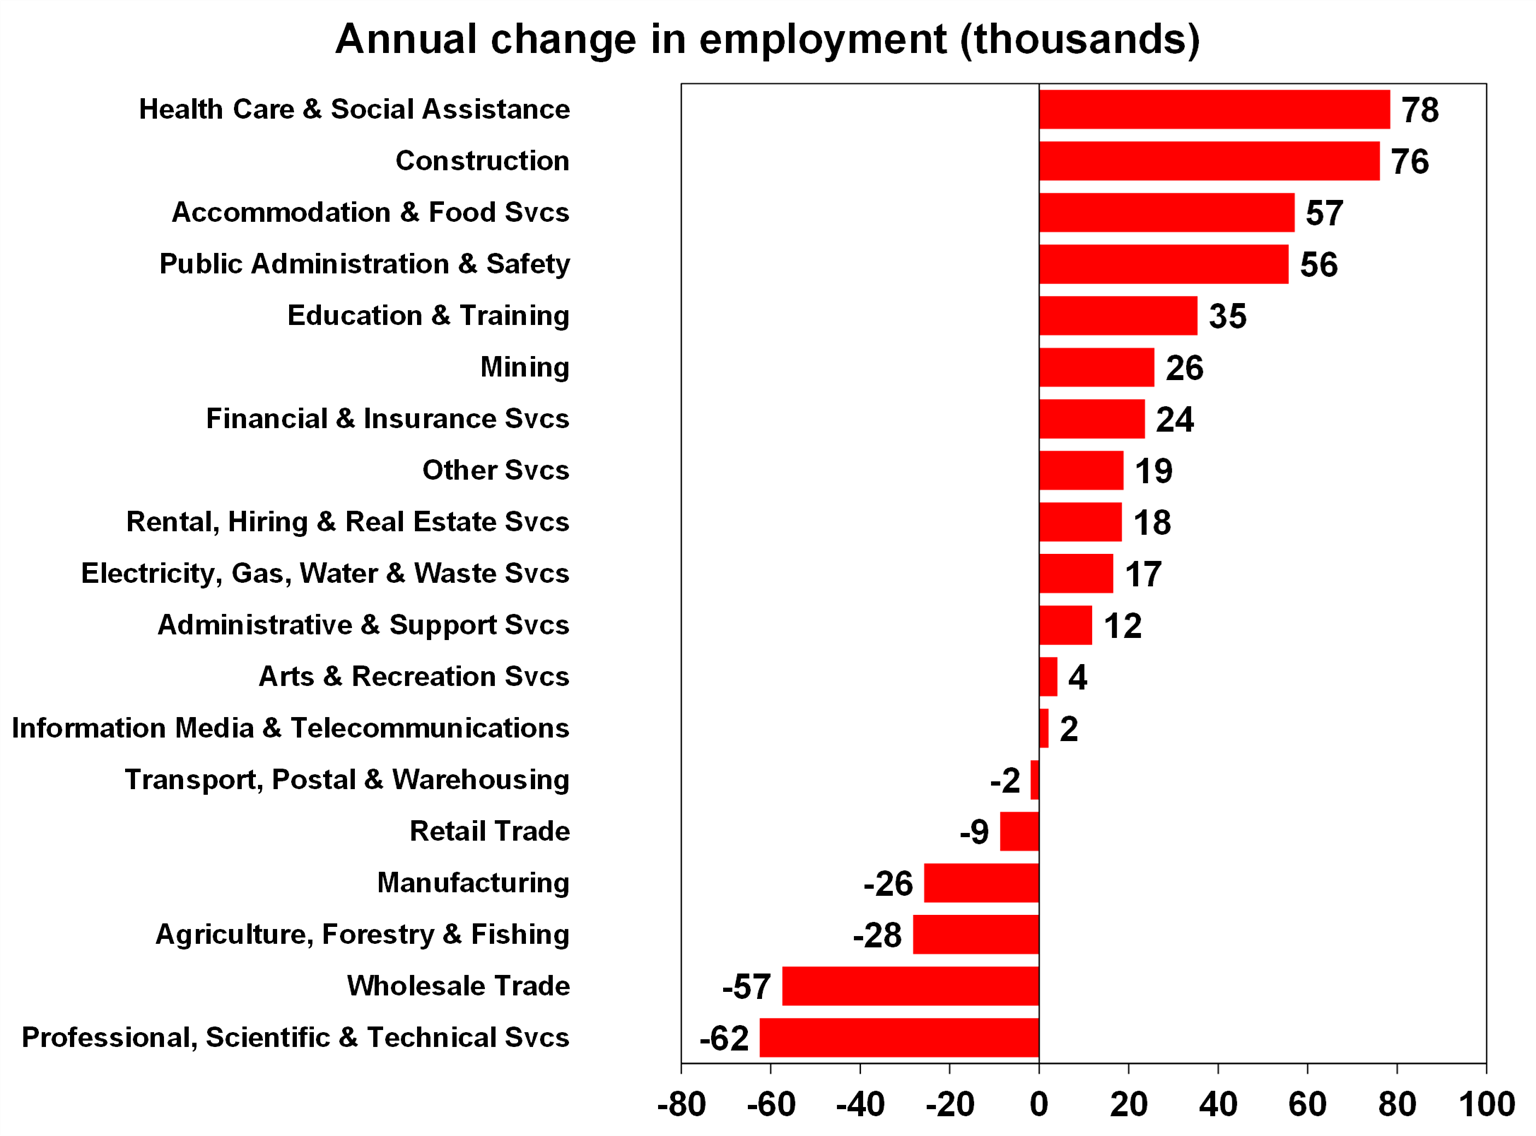
The detailed quarterly jobs data showed that over the year to February, the largest job gains were in healthcare and social assistance, construction and public administration and safety. Job losses occurred in professional services, wholesale trade, agriculture, manufacturing, retail and transport. Over the last 12 months, healthcare and social assistance, education and training and public administration and safety have generated 73% of jobs growth. The ballooning public sector has been a cause of concern for many in recent times, but Dutton’s plan to slash the Federal government service will not change that jobs are going to healthcare primarily which is related to NDIS spending.
What to watch over the next week?
The Reserve Bank of Australia will meet next Tuesday and this will be the first meeting of the RBA’s new Monetary Policy Board. Remember that the Board has been split into a governance board and a monetary policy board, who set interest rates. Despite cutting the cash rate from 4.35% to 4.1% in February, the post-meeting commentary, comments in the Statement on Monetary Policy which updated the RBA’s forecasts and speeches from RBA officials sounded hawkish, implying that further rate cuts are not necessarily on the horizon. Australian economic data since the last RBA meeting has mostly been positive, with better consumer confidence readings, a flat unemployment rate, an improvement in the PMI and more good news on inflation. Financial markets still have 2.5 rate cuts priced in by December which is fair. We expect a 0.25% rate cut at the May and August meetings. RBA Assistant Governor (Financial Markets) speaks at the KangaNews Debt Capital Market Summit next week and the semi-annual Financial Stability Review is released next Thursday. Australian data releases next week include the credit data, March CoreLogic (now known as Cotality) home prices which are currently 0.3% higher over the month across capital cities, retail trade (we expect a +0.4% rise or February), building approvals (-1.5% fall over the month for February is likely), trade figures (a trade surplus of $5.4bn is expected), job vacancies (another improvement is likely) and household spending indicator (we expect a 0.4% rise over February).
US job openings and labour turnover (otherwise known as JOLTs) are likely to show a slowing in job openings, after a lift last month although openings are still elevated relative to history. Non-farm payrolls (on Friday) for March may show a further hit to Federal government employments from DOGE impacts, but will not be enough to cause an outright fall in jobs. The March ISM manufacturing and services reading will confirm if the improvement in services activity was also evident. Other indicators which will feed into forecasts for March quarter GDP (which is looking like it will be low) include regional PMI’s, factory orders data and trade figures.
Japanese monthly data to watch includes retail sales, the unemployment rate and the Q1 Tankan business survey. Japanese activity data has been on the soft side, but the Bank of Japan wants to raise rates to slow inflation which will be hard to do if the data continues to deteriorate.
In China, March PMI’s are released and are expected to show better activity over the month.
Outlook for investment markets
After the double digit returns of 2023 and 2024, global and Australian shares are expected to see far more constrained returns this year. Stretched valuations, the increasing risk of a US recession, Trump’s trade war and ongoing geopolitical issues – including a high probability that the US will launch strikes against Iran’s nuclear capability if diplomacy doesn’t work - will likely make for a volatile ride with a 15% plus correction highly likely. But central banks, including the RBA, still cutting rates, prospects for stronger growth later in the year supporting profits, and Trump’s tax and deregulation policies ultimately supporting US shares, should still mean okay investment returns through the year as a whole.
Bonds are likely to provide returns around running yield or a bit more, as inflation slows to target, and central banks cut rates. Unlisted commercial property returns are likely to improve in 2025 as office prices have already had sharp falls in response to the lagged impact of high bond yields and working from home. Australian home prices have likely started an upswing on the back of lower interest rates. But it’s likely to be modest given poor affordability. We see home prices rising around 3% in 2025. Cash and bank deposits are expected to provide returns of around 4%, but they are likely to slow as the cash rate falls. The $A is likely to be buffeted between changing perceptions as to how much the Fed will cut relative to the RBA, the negative impact of US tariffs and a potential global trade war and the potential positive of more decisive stimulus in China. This could leave it stuck between $US0.60 and $US0.70, but with the risk skewed to the downside as Trump ramps up tariffs.
Important information
While every care has been taken in the preparation of this document, neither National Mutual Funds Management Ltd (ABN 32 006 787 720, AFSL 234652) (NMFM), AMP Limited ABN 49 079 354 519 nor any other member of the AMP Group (AMP) makes any representations or warranties as to the accuracy or completeness of any statement in it including, without limitation, any forecasts. Past performance is not a reliable indicator of future performance. This document has been prepared for the purpose of providing general information, without taking account of any particular investor’s objectives, financial situation or needs. An investor should, before making any investment decisions, consider the appropriateness of the information in this document, and seek professional advice, having regard to the investor’s objectives, financial situation and needs. This document is solely for the use of the party to whom it is provided. This document is not intended for distribution or use in any jurisdiction where it would be contrary to applicable laws, regulations or directives and does not constitute a recommendation, offer, solicitation or invitation to invest.